
Baseball CNN
A binary classifier that uses a convolutional neural network to classify dynamic image data from a baseball video game.
Background
While taking my Deep Learning course in Fall 2019, I was given the option to do an implementation of a deep learning concept as a term project. This assignment had a ton of freedom. My partner, Henry Herzfeld (GitHub) (LinkedIn), and I knew that we wanted to do a CNN, but we were struggling to come up with a unique idea. Knowing that Deep Learning can be applied to anything if one can clearly define a problem, I came up with a unique idea: what if we use a CNN as a step to improve performance in a sports video game?
As of this writing, MLB The Show is a baseball simulation video game developed annually by Sony San Diego Studios primarily for the PlayStation 4. It is a game franchise that I started playing religiously in 2014 and still enjoy to this day. It provides one of the more convincing simulations of MLB action that exists on the market. It does a very nice job of simulating the difficulty of arguably one of the hardest things in sports: hitting a baseball.

To demonstrate this, I invite the reader to watch the video below of batting gameplay in MLB The Show 19:
From this footage, you can see that the player has very little time to react to the ball coming towards them, right? In fact, this video was recorded at 30 frames per second. We found that we can take 15 frames from when the ball is released and roughly obtain the frame where the ball reaches home plate. This means that it takes roughly 0.5 seconds from the time the pitch is thrown for it to reach home plate. Not much, right? The challenge comes when trying to figure out the following in those 0.5 seconds:
- The box in the center of the screen that disappears once the pitch is thrown and reappears once the pitch reaches home plate represents the strike zone. A ball that is inside the box is a strike, and a ball that is outside the zone is a ball. It is generally good practice for a batter not to swing at any balls. So, a successful player should be able to determine from the path of a pitch whether it is a ball or a strike in the 0.5 seconds mentioned.
- When should a player swing? This is something that for a while I could only answer with trial and error with feedback from the game. But, thanks to the footage obtained for this project, I now have a concrete answer. If you look closely, you should be able to see a shadow underneath the baseball as it travels towards home plate. Pay attention to the point where green grass becomes brown dirt in front of home plate. Generally, if the player swings:
- Right after the shadow of the ball crosses the brown dirt if the pitch is further away horizontally from the batter (outside)
- Right as the shadow of the ball crosses the brown dirt if the pitch is going to land in the center of the strike zone
- Right before the shadow of the ball crosses the brown dirt if the pitch is closer horizontally to the batter (inside)
Each of the issues described above can each be its own project. We decided to see if we could use a CNN to address the first problem: classifying balls vs. strikes.
Methods
Data Collection
With any machine learning problem, the most challenging and time-consuming part is often data collection. This applies to deep learning as well. In order for a convolutional neural network (CNN) to perform classification on image data, we must first collect the data. To accomplish this, I used the PS4's built in screen-recording feature. I sat down and recorded several unique, full, 9-inning games where I did not swing at any pitches. Then we copied this footage onto a USB drive to examine it from our machines.
Labeling
Next comes the biggest challenge, labeling. Image classification problems often have thousands or tens of thousands of images to use as data. Generally, for a neural network model to measure its performance when it makes a classification, it usually checks its prediction against a "ground-truth answer." So, any pitches used as part of our dataset need to be labeled as "ball" or strike for the purposes of measuring the performance of the network. It is unrealistic to go through the video manually, pick out every moment where a pitch begins/ends, and label it manually based on feedback from the game. Henry wrote a labeling script to allow us to automate this process for each game I recorded. The script wasn't perfect, but it reduced the time it would take to manually label significantly.
Through this process we were able to obtain 1080 pitches. We stacked 15 consecutive frames of the ball traveling as a single pitch instance. So, we have a total of 16,200 images in our dataset.
Downsampling
The sample footage shown above was recorded in 720p at 30 frames per second. The videos we used for our project were recorded in 1080p at 30 frames per second. The computational complexity of a CNN makes it unrealistic to expect that a neural network can train on 16200 1920x1080 RGB images in a reasonable amount of time. So, it became necessary to downsample our images.
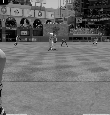
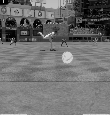
So, we changed our images from RGB to grayscale and downsampled them from 1920x1080 to 115x110. Some cropping was also performed to eliminate extraneous information from the image. Two samples of frames from a pitch are shown below:
Frame Differencing
Now that we have our downsampled images, we must perform one more transformation before we begin the network training. Since we chose to stack 15 frames together to represent a single pitch instance, we subtracted two of the frames from each other to obtain a resulting image showing the difference between the two frames. We trained our CNN on these differences, in an attempt to get the network to recognize the motion of the ball. This is known as frame differencing.
Experiments
We trained a CNN using several different well-known architectures from research. Using each of these architectures, we ran the train and test process 10 times using 5 and 10 fold cross validation. The main performance metric we used to compare network architecture performance was accuracy.
Results
You can view the results of the experiments described above in the "Results" folder of the Github repo found here.